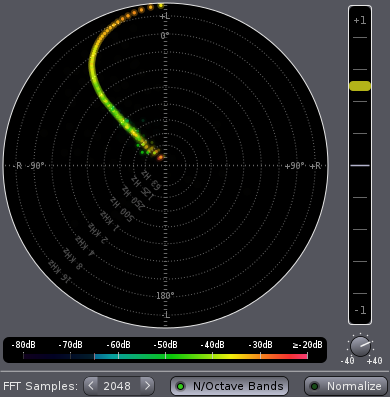
| | | | |
| 0) Control | (control)
0) Control
(Atom Input)
GUI to plugin communication
Designation:
| | (notify)
1) Notify
(Atom Output)
Plugin to GUI communication
Designation:
| 1) Notify |
| 2) InL | (in1)
2) InL
(Audio Input)
Channel 1 input
| | (out1)
3) OutL
(Audio Output)
signal pass-thru
| 3) OutL |
| 4) InR | (in2)
4) InR
(Audio Input)
Channel 2 input
| | (out2)
5) OutR
(Audio Output)
signal pass-thru
| 5) OutR |
| 7) Gain | (gain)
7) Gain
(Control Input)
Display Signal Level Gain.
| | (phase)
6) phase
(Control Output)
Stereo Phase Correlation (all bands)
| 6) phase |
| 8) Cutoff | (cutoff)
8) Cutoff
(Control Input)
Display Signal Cutoff Level (relative to 0dB). Signals below this level will not be visualized.
| | | |
| 9) FFT Size | (fftsize)
9) FFT Size
(Control Input)
Number of audio-samples to process. Large values increase accuracy (particular for low frequencies) as well as latency.
Port Properties:
| | | |
| 10) N/Octave Bands | (band)
10) N/Octave Bands
(Control Input)
Group data by frequency bands. Depending on FFT-size, 6 or 12 bands per octave are used. This allows for 1/frequency (pink noise) signal level normalization. It also speeds up visualization for large FFT sizes and decreases CPU/GPU usage due to visualization.
Port Properties:
| | | |
| 11) Normalize | (normalize)
11) Normalize
(Control Input)
Auto-gain. Normalize signal level, set gain to detected (per band) peak signal level.
Port Properties:
| | | |
| 12) Screen Persistence | (persistence)
12) Screen Persistence
(Control Input)
Screen persistence (fade out speed). 0: no persistence, 100: permanent. Values above ~66 result in a permanent shadow.
| | | |
| | | | |
